Empowering users with simple, actionable insights

Empowering users with simple, actionable insights

As part of the evolution of a creator program, we developed a feature that helps creators understand the performance of their content and turn that data into action — while also making it easier to attract higher-profile talent.

As part of the evolution of a creator program, we developed a feature that helps creators understand the performance of their content and turn that data into action — while also making it easier to attract higher-profile talent.

Client

NWB

Industry

Influencer Marketing

My role

Product Designer

Role

UI

Year

2024

Mockup showing three mobile screens from the NWB – Network Brasil app interface. The screens display influencer performance data: weekly achievements, engagement charts from their Instagram feed, and the user’s ranking in the “Corredores Bronze” team based on follower count.
Mobile screen from the NWB app showing the “Influence on the Feed” section. The interface displays a bar chart comparing the user’s daily Instagram performance with the team average, from June 12 to 17. Below the chart, there’s a highlight of the user’s current score and a trophy indicating their top ranking.

Problem

01

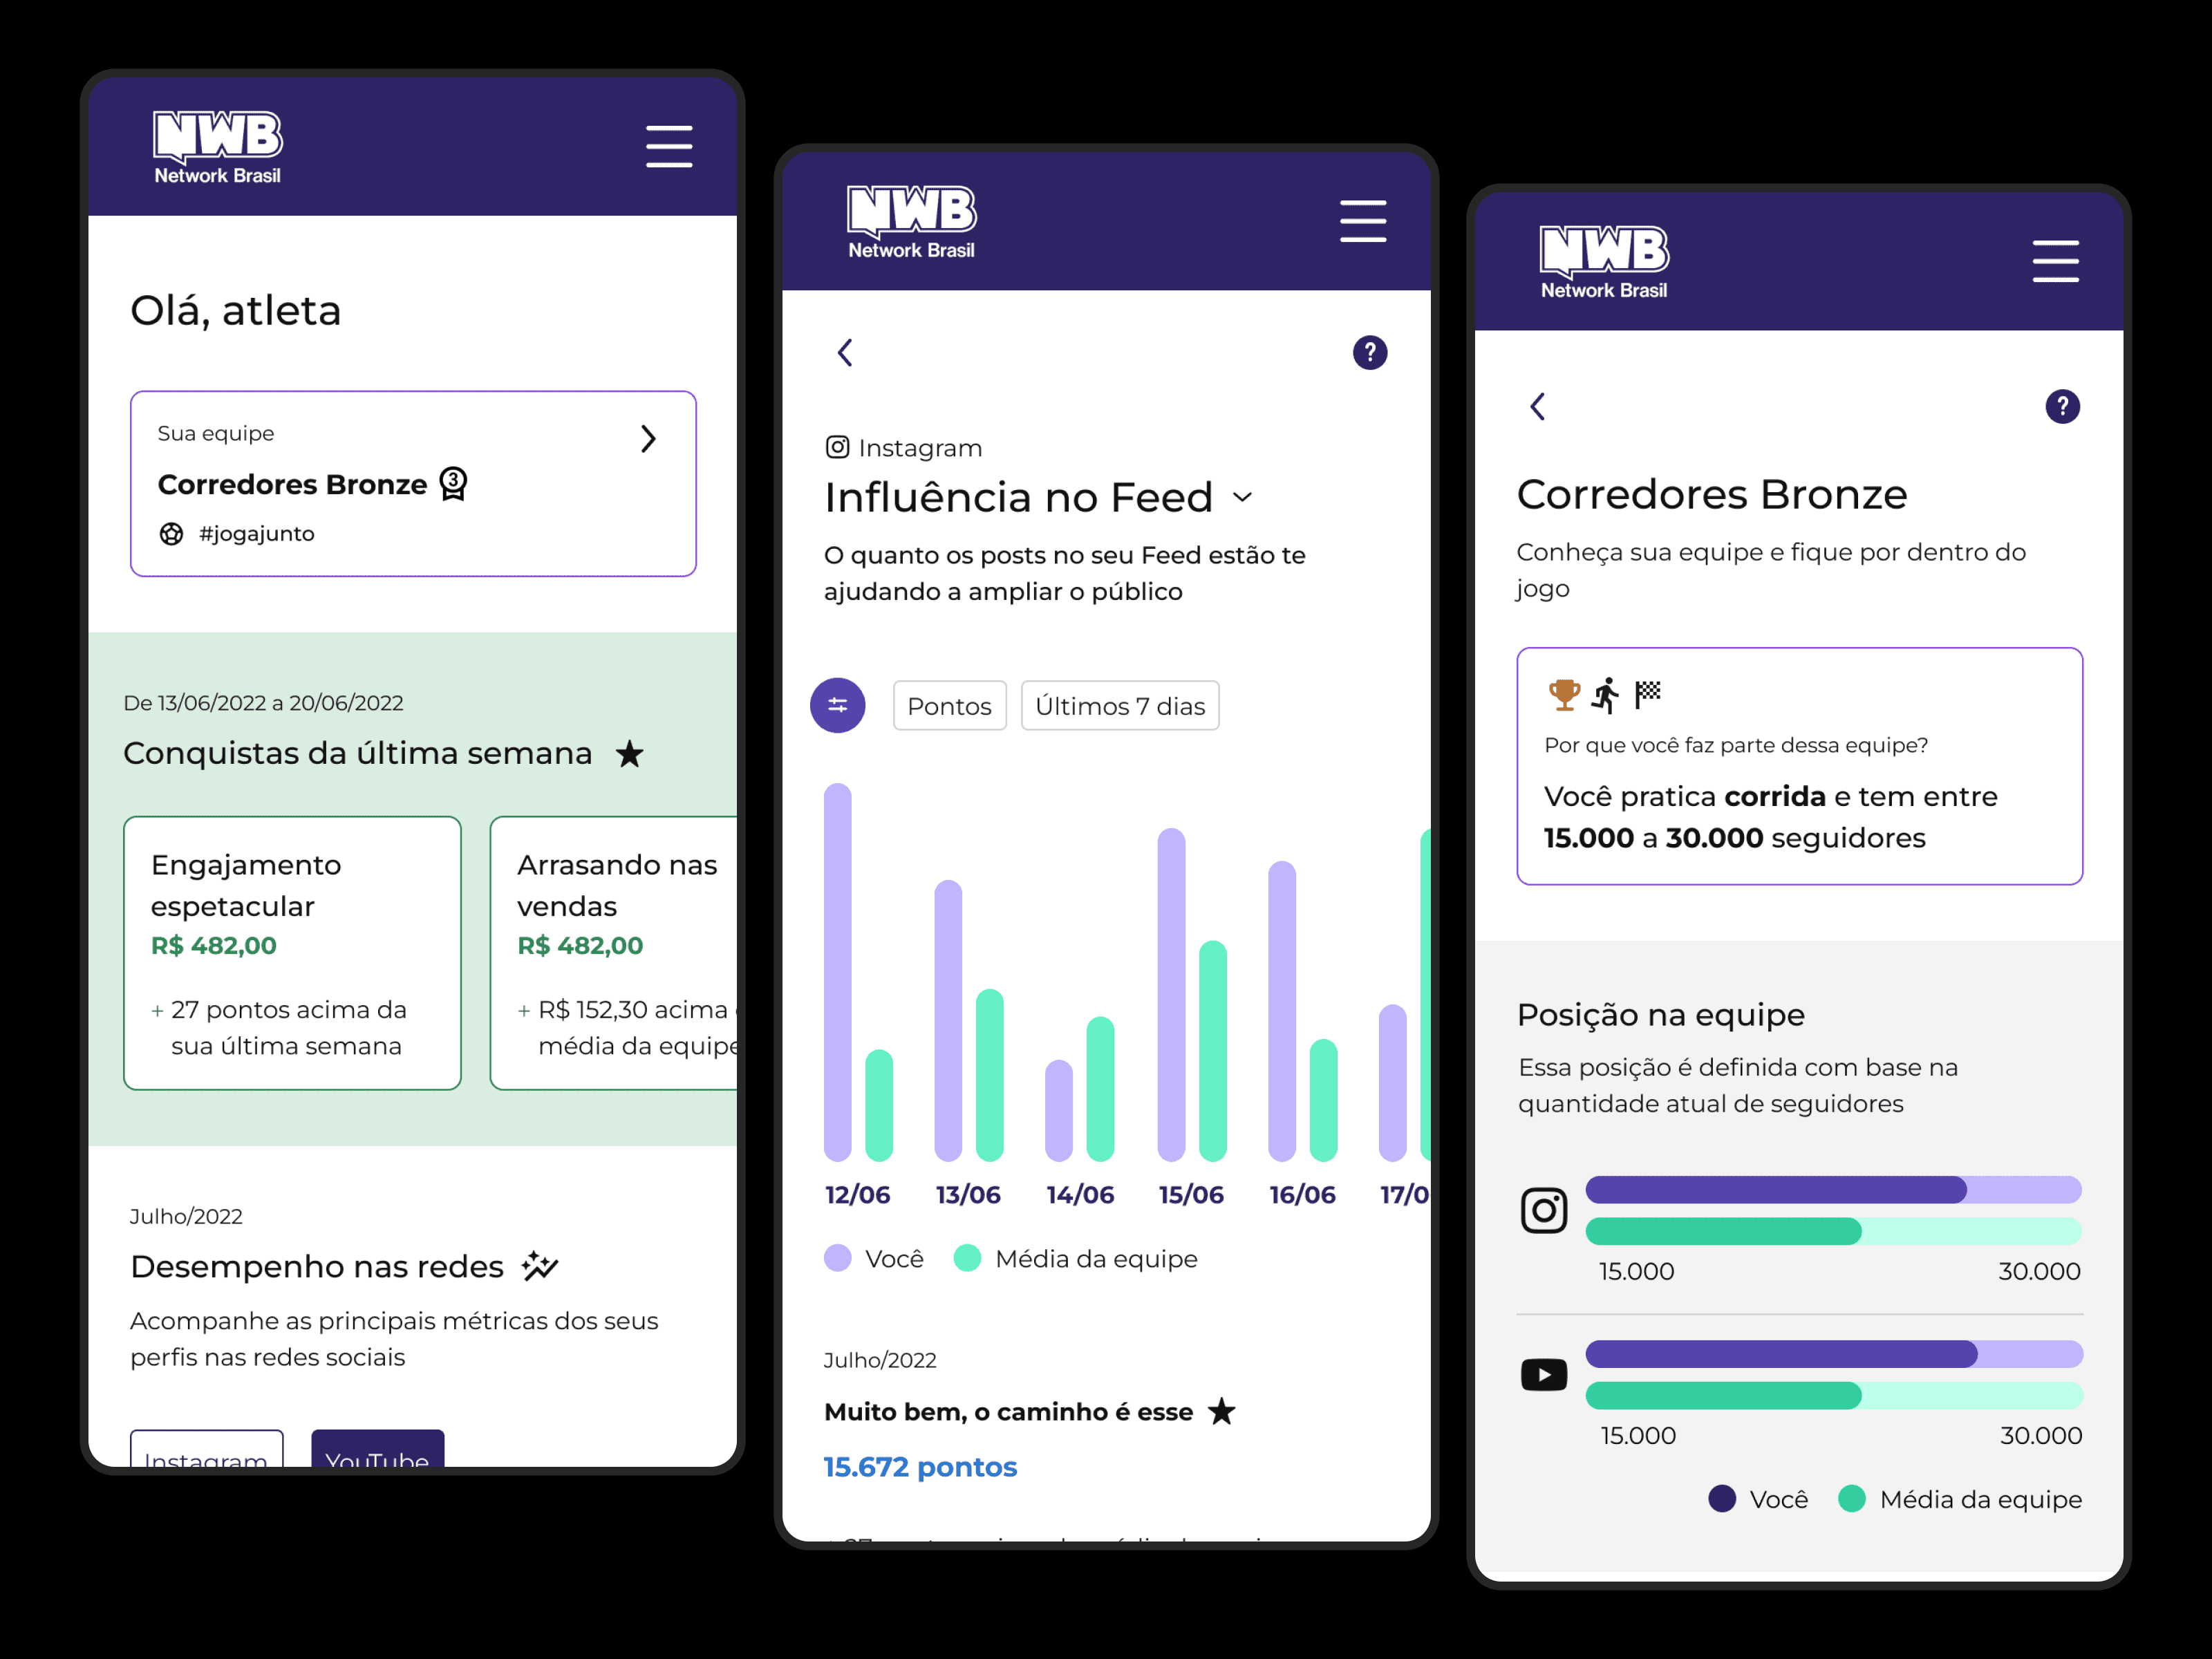
As part of evolving a creator program, we developed a feature that helps creators understand their content performance and turn data into action — while also making it easier to attract higher-level talent.

Challenge

02

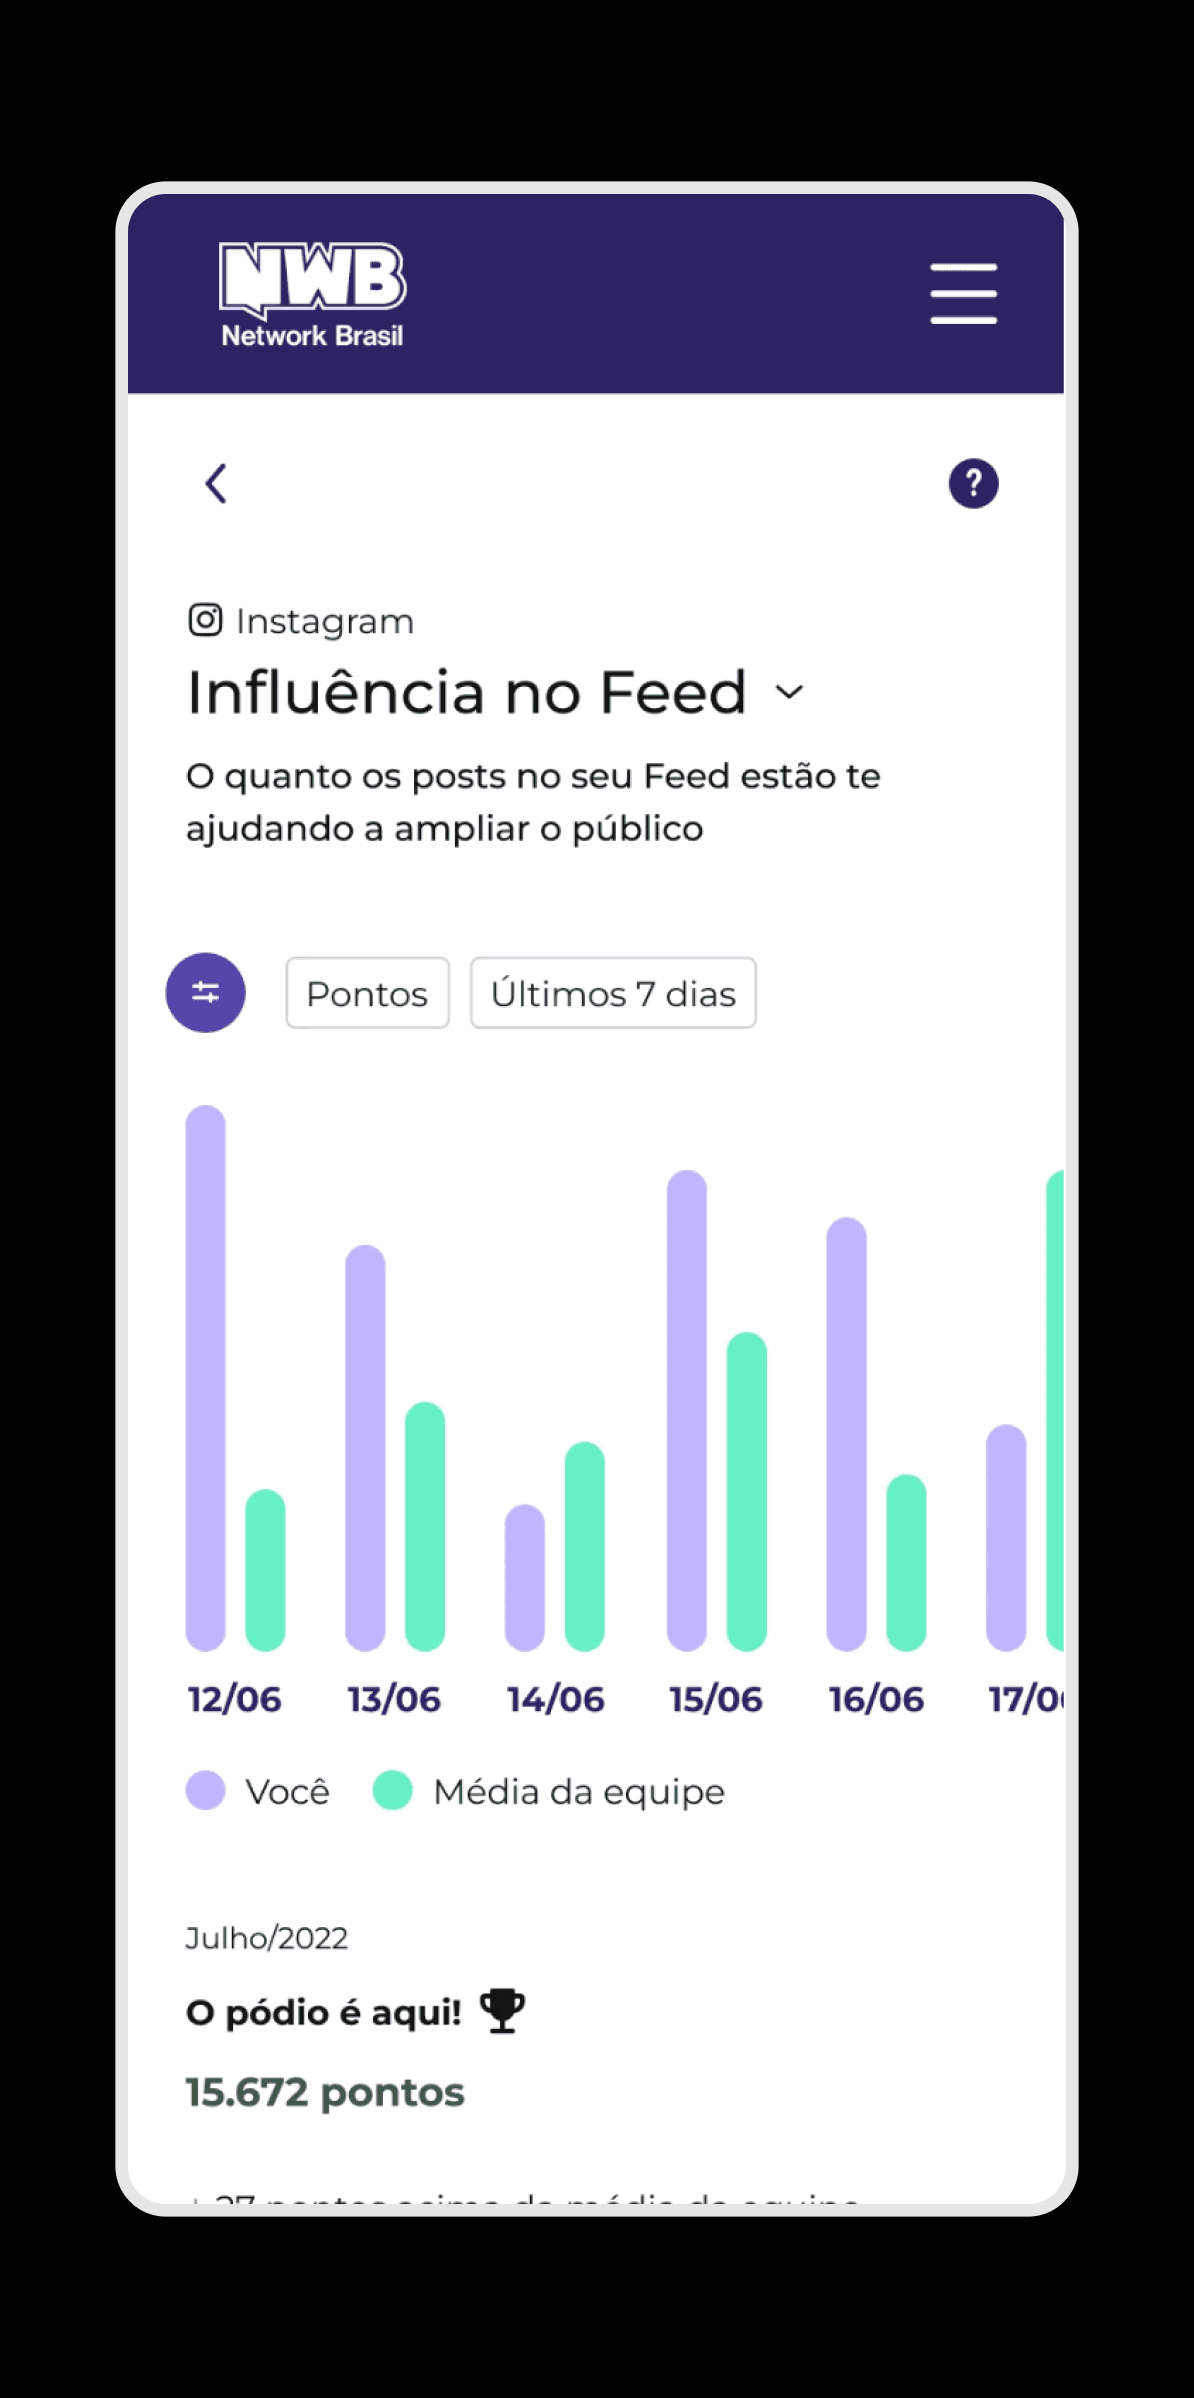
  1. Dashboard with a simplified, user-friendly view of reach and engagement


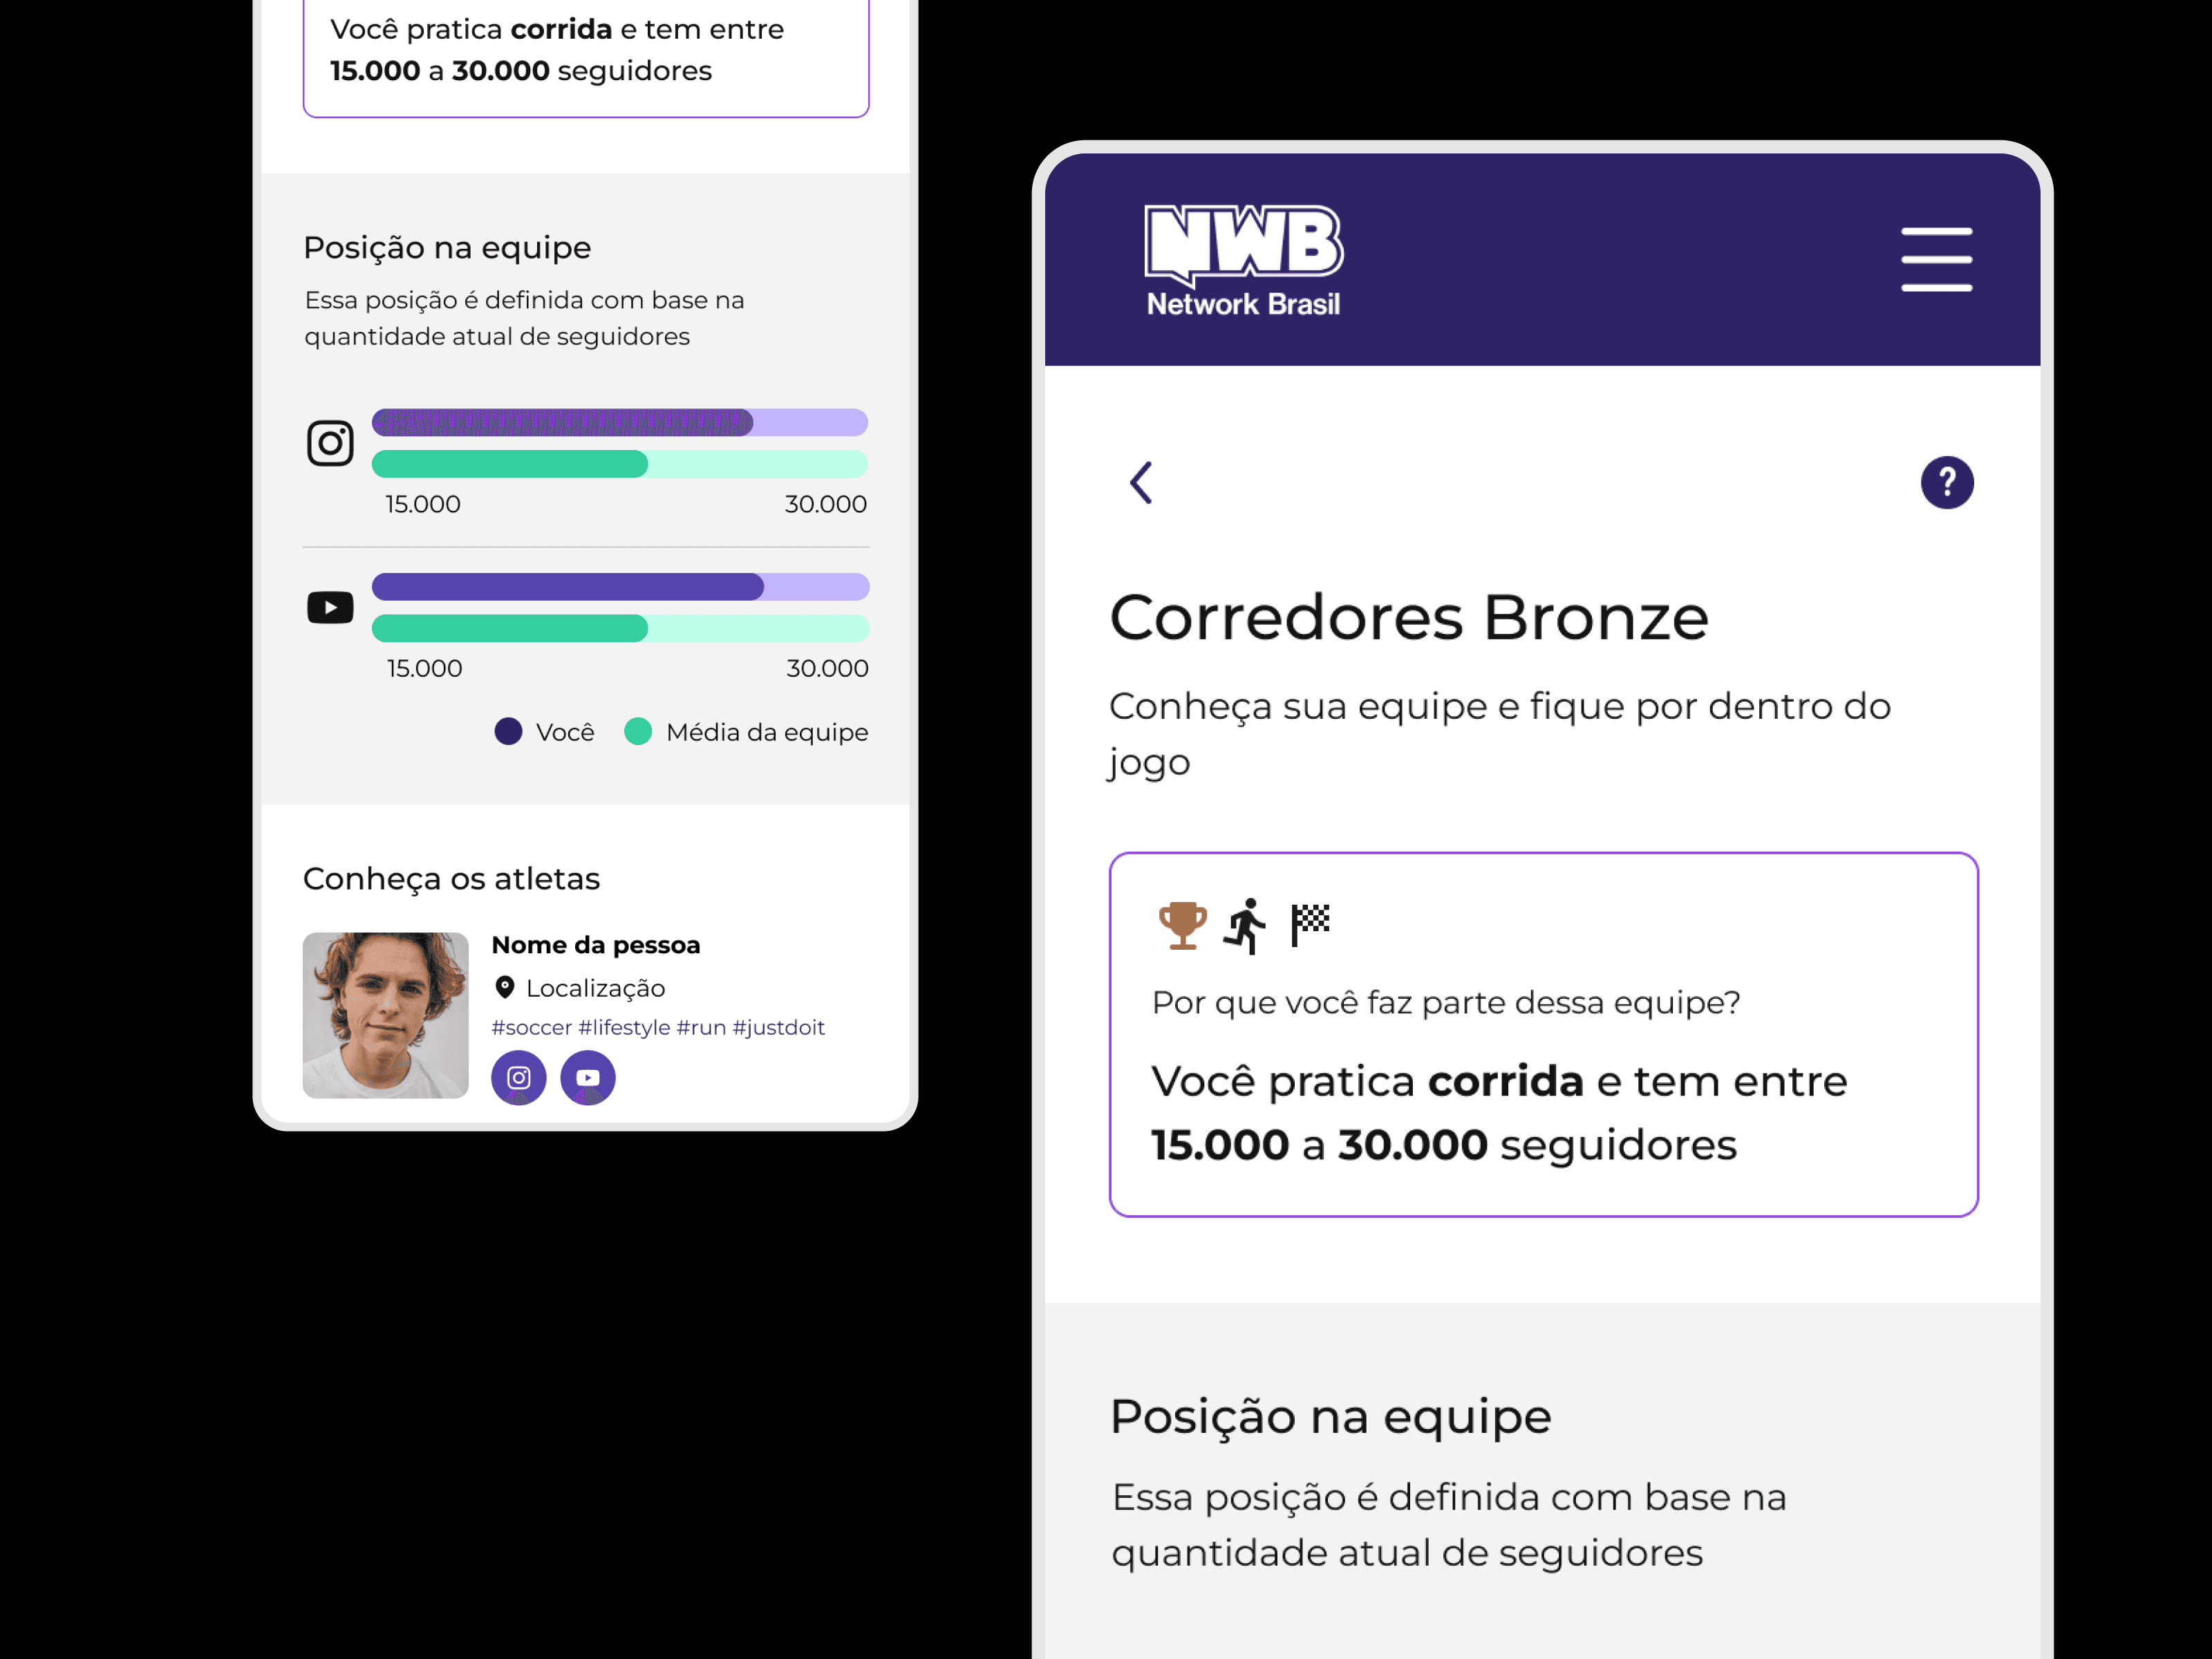
  2. Comparison with the creator’s own historical data and peers in the same niche


  3. High-performing content suggestions for inspiration


  4. Tool initially launched for macro and mega creators

Goals

03

  1. Help creators understand their performance on Instagram and YouTube


  2. Turn metrics into actionable insights


  3. Simplify data consumption without overwhelming the user

Nike e-commerce website interface showing a central banner with a diverse group of people posing on an urban sports court, in front of a concrete wall.

Approach

04

Qualitative deep dive

01

In-depth interviews with creators to understand their pain points, needs, and behaviors.

Definition and prioritization

02

Empathy map and creator journey to visualize and prioritize pain points.

Mobile screen from the NWB app showing “Feed Influence” data, with a bar chart comparing the user’s performance to the team average on Instagram. Below the chart are influence metrics such as follower growth and impressions, along with a ranking of the most influential posts from both the user and the team over the past 30 days.
Screenshot showing three mobile interfaces from the NWB – Network Brasil app. The first screen displays a dashboard with weekly achievements, social media performance, and progress cards. The second features a bar chart on Instagram feed influence, engagement metrics, and a ranking of the most influential posts. The third presents information about the “Corredores Bronze” team, a comparison of follower counts across social networks, and a list of athlete profiles.

Results


05

New talents

01

Onboarding of 97 new macro influencers, resulting in a 1,112.5% increase in profile presence.

New talents

01

Onboarding of 97 new macro influencers, resulting in a 1,112.5% increase in profile presence.

Follow up

Follow up

02

18% increase in audience engagement among monitored large-profile creators.

Follow up

02

18% increase in audience engagement among monitored large-profile creators.

Engagement

03

32% increase in audience engagement among nano and micro creators, and 18% among large creators, three months after rollout.

Engagement

03

32% increase in audience engagement among nano and micro creators, and 18% among large creators, three months after rollout.

Learnings

06

Helping creators understand their results impacts not only their performance, but also their relationships with brands and fellow creators.